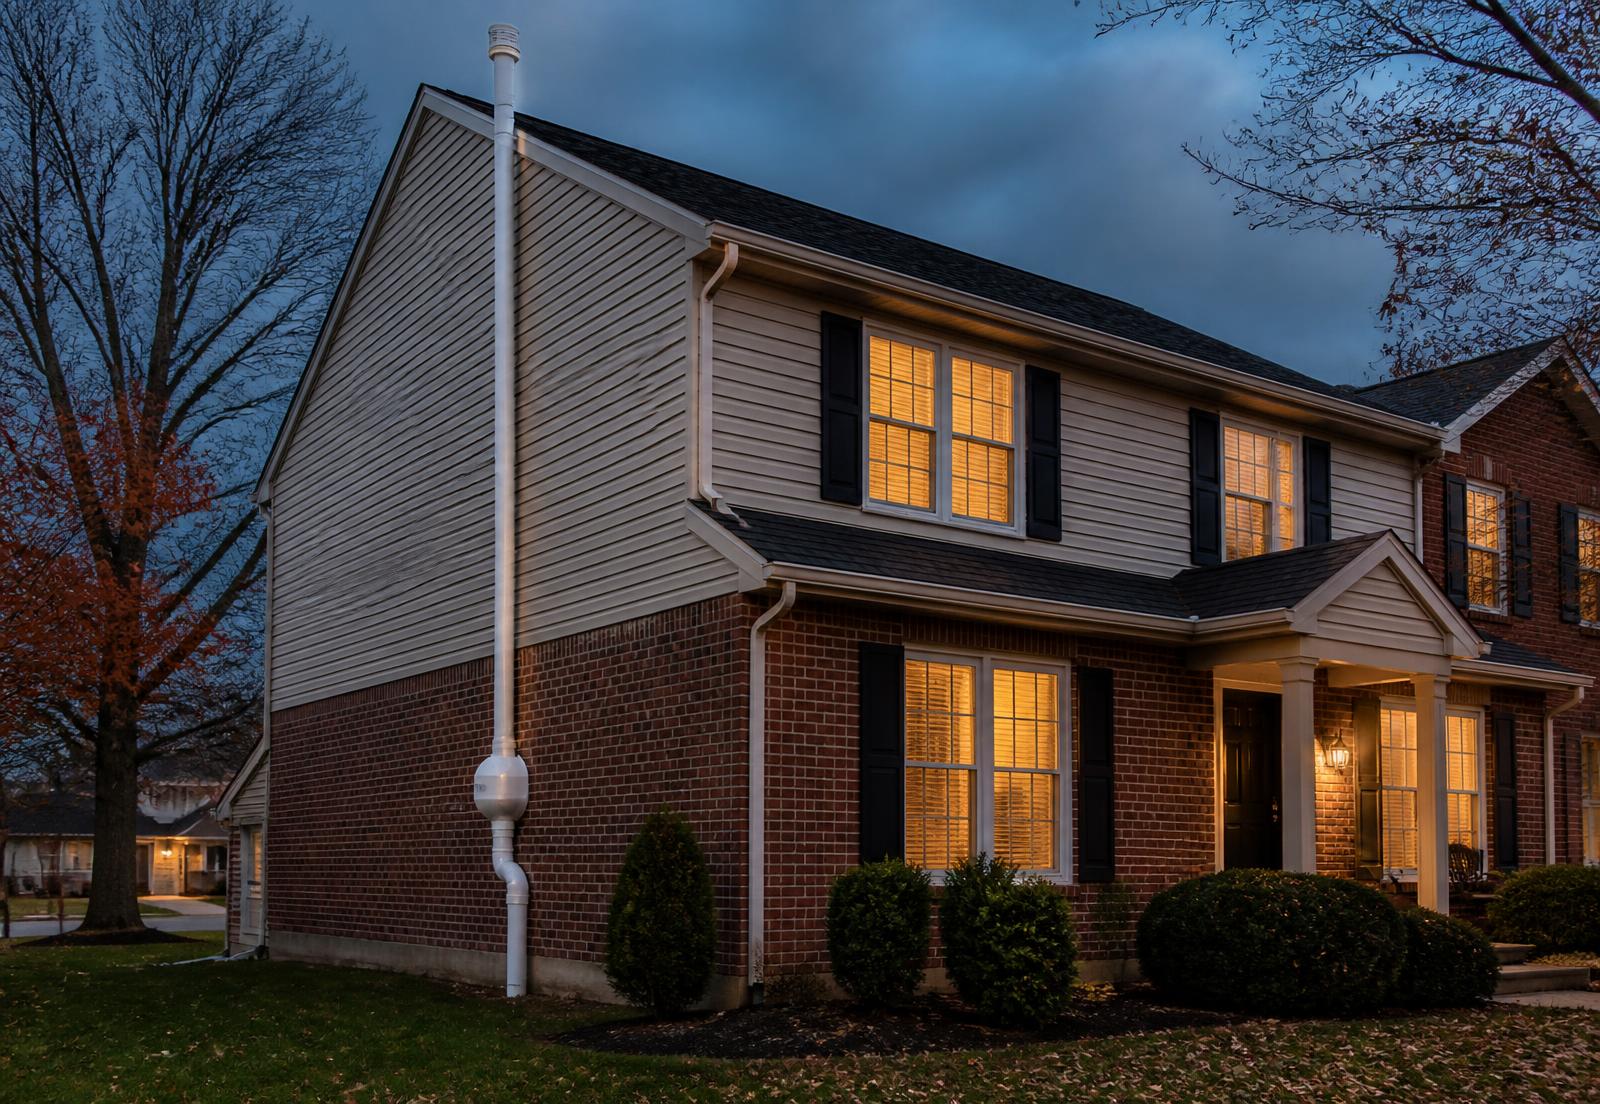
What the EPA Zone Map Actually Measures
EPA's radon zone map assigns each U.S. county to one of three zones based on predicted average indoor radon screening levels, derived from geology, soil characteristics, aerial radioactivity data, and historical indoor test results aggregated at the county level. Zone 1 counties have a predicted average above 4 pCi/L, Zone 2 counties fall between 2 and 4 pCi/L, and Zone 3 counties are predicted below 2 pCi/L.
This is fundamentally a planning and awareness tool. EPA designed it to help building code officials, public health programs and the general public understand broad regional patterns, not to tell any individual homeowner what their house will read. The map has never been intended, and should never be used, as a substitute for testing a specific address.
Indiana's County Designations
Marion County and most of the counties surrounding Indianapolis, including Hamilton, Hendricks, Johnson, Boone, Hancock, Morgan and Shelby, are classified as Zone 1. This pattern reflects Central Indiana's glacial till and underlying bedrock, discussed in more depth on the Indiana Radon Guide. The majority of Indiana's 92 counties carry a Zone 1 designation, with a smaller number falling into Zone 2 reflecting somewhat different underlying geology in those areas.
It's worth noting that a Zone 1 designation is common across the state, so for most Indiana homeowners the practical takeaway isn't which zone they happen to fall in, since most fall in the same one, but that they live in an area where testing is broadly worthwhile regardless of specific county lines.
Why Adjacent Homes Can Differ Widely
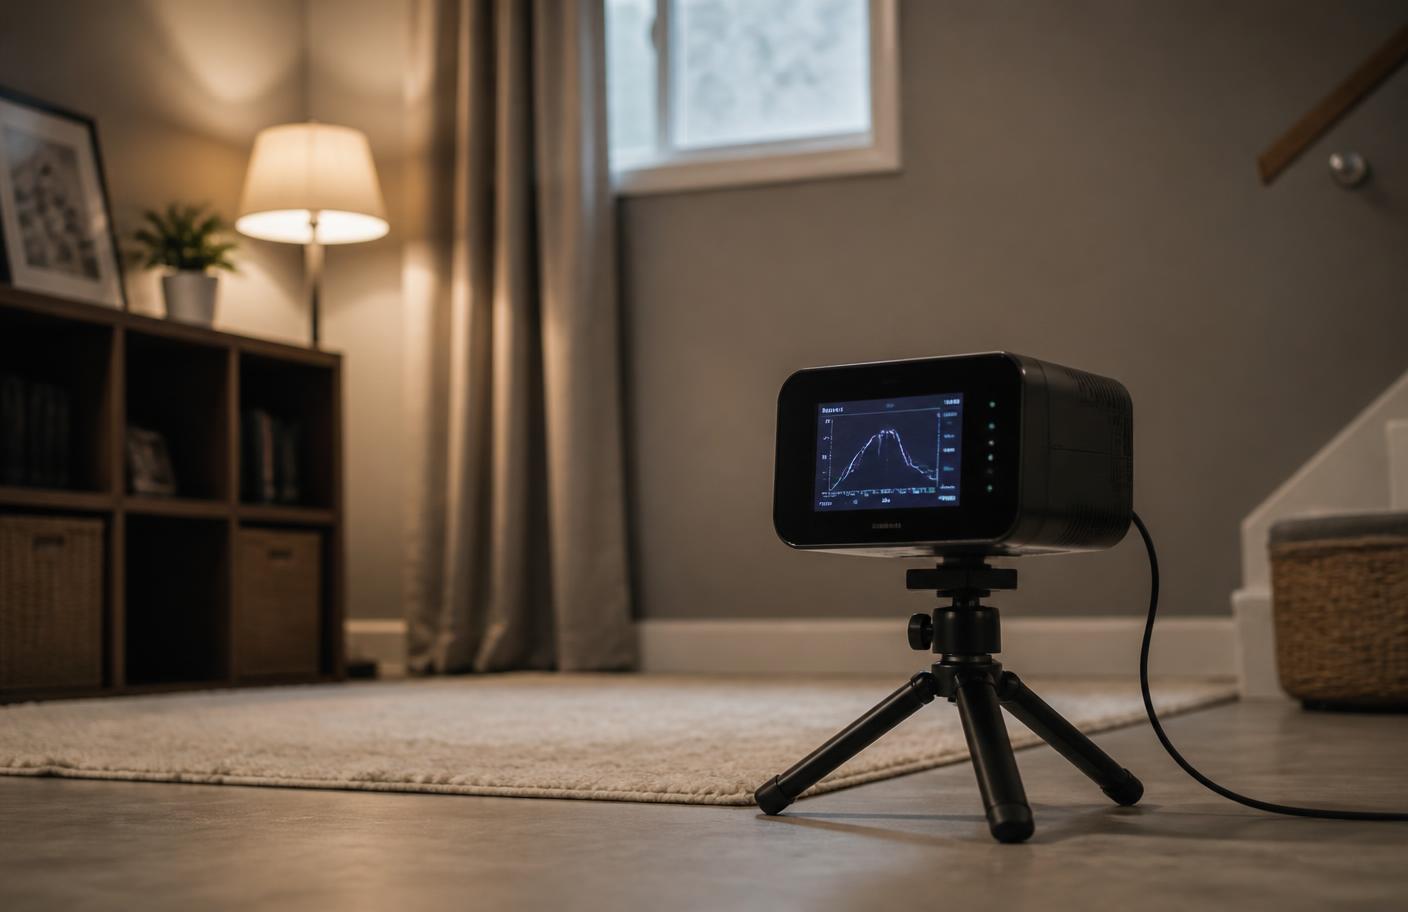
Because the zone designation is a county-level average built from aggregated data, it says nothing about the variation between individual properties. Foundation type, sealing quality, sump pit configuration, HVAC operation and even how a house sits relative to local soil pockets can all push one home's reading well above or below its neighbor's, even within the same subdivision.
This is the map's central and unavoidable limitation as a decision-making tool: a Zone 1 designation means testing is broadly worthwhile across the county, but it cannot tell you whether your specific home is at 1 pCi/L or 12 pCi/L. Only a test performed at that address can answer that question, which is the subject of the Indiana Radon Testing Guide and the Indiana Radon Levels Guide for interpreting the result once you have it.
- The zone map reflects predicted county averages, not individual home data
- Zone 1 designation applies to most of Indiana, including Marion and surrounding counties
- Foundation type, sealing and HVAC operation vary far more than county lines do
- A test at the specific address is the only way to know an individual home's level
How the Map Gets Misused
A common misreading is treating a Zone 2 or Zone 3 designation as reassurance that testing is unnecessary. Because the map reflects an average, it still implies that some homes within lower-zoned counties test above the action level; the designation simply means fewer of them do on average. Conversely, living in a Zone 1 county doesn't mean every home there is elevated, only that testing is broadly advisable.
Another common error is citing the map in a real estate negotiation as if it settles the question of whether a specific home has a radon problem. It doesn't, and shouldn't be presented that way; an actual test result is the only relevant evidence in that context.
Where to View the Official Map
EPA publishes the current zone map and county-by-county designations through its national radon program, and the Indiana Department of Health's Indoor and Radiologic Health program is the appropriate place to verify any state-specific context around Indiana's designations. This guide summarizes the general pattern relevant to Central Indiana but readers should consult those sources directly for the current, authoritative map.
Using the Map Appropriately
The map's proper use is as a starting point for public awareness: it explains why radon testing is emphasized so consistently across Indiana real estate and home inspection conversations, and why professionals in Zone 1 counties routinely recommend testing regardless of a home's age or type. Its proper use ends there; decisions about mitigation should always be based on an actual test result interpreted using the guidance on the Indiana Radon Levels Guide.