The Scale and the Action Level
Radon is measured in picocuries per liter of air (pCi/L). EPA sets 4.0 pCi/L as the action level, the point at which mitigation is recommended, and suggests homeowners consider action when results fall between 2 and 4 pCi/L as well. There is no known safe level of radon exposure according to EPA and CDC, meaning even results below 2 pCi/L still represent some level of exposure, just a lower one.
It's worth stating plainly: these thresholds apply to an individual, valid test result from your home, not to a neighborhood or county average. Two homes on the same Indianapolis block can post meaningfully different readings depending on foundation type, sealing, and how the HVAC system operates.
What a Typical Distribution of Results Looks Like
Within Indiana's higher-potential counties, test results across a neighborhood generally span a wide range rather than clustering tightly around one number. Some homes test well under 2 pCi/L, others land in the 2 to 4 pCi/L range where EPA suggests considering action, and a portion test above 4.0 pCi/L and clearly warrant mitigation. This spread is exactly why the county-level zone designation, discussed on the Indiana Radon Map Guide, functions only as a planning signal and never as a substitute for testing a specific address.
Homes with finished basements used as everyday living space, homes with known foundation cracks or sump pits, and homes with tighter, more energy-efficient building envelopes can all trend toward the higher end of that range, though none of these factors guarantees a high result on their own.
- Below 2 pCi/L: generally lower concern, though no level is considered fully risk-free
- 2 to 4 pCi/L: EPA's range where homeowners are encouraged to consider mitigation
- 4.0 pCi/L and above: EPA's action level, where mitigation is recommended
Seasonal Variation in Indiana
Because Indiana's stack effect strengthens during the heating season, radon readings commonly run higher from roughly October through April, when homes are sealed against cold and furnaces run continuously, and lower in spring and summer when windows open more often and mechanical systems cycle less. A test conducted in July might read differently than the same home tested in January.
This is why a single short-term test, while useful, is a snapshot rather than a full picture, and why EPA recommends confirmation testing before deciding on mitigation, and why a long-term test, run for 90 days or more, better captures a home's average exposure across that seasonal swing.
Reading a Continuous Monitor's Output
Continuous radon monitors, increasingly used in professional short-term tests, log hourly data rather than producing a single averaged number, which lets a technician see whether a result was steady throughout the test or skewed by an isolated event, such as a door left open. Homeowners reviewing this kind of report should look at the overall trend line rather than fixating on any single hourly spike.
This level of detail goes beyond what a simple passive charcoal test can offer and is one reason continuous monitoring has become more common for real estate transactions where result integrity matters. The Continuous Radon Monitoring guide covers this technology in more depth.
When a Level Warrants Mitigation
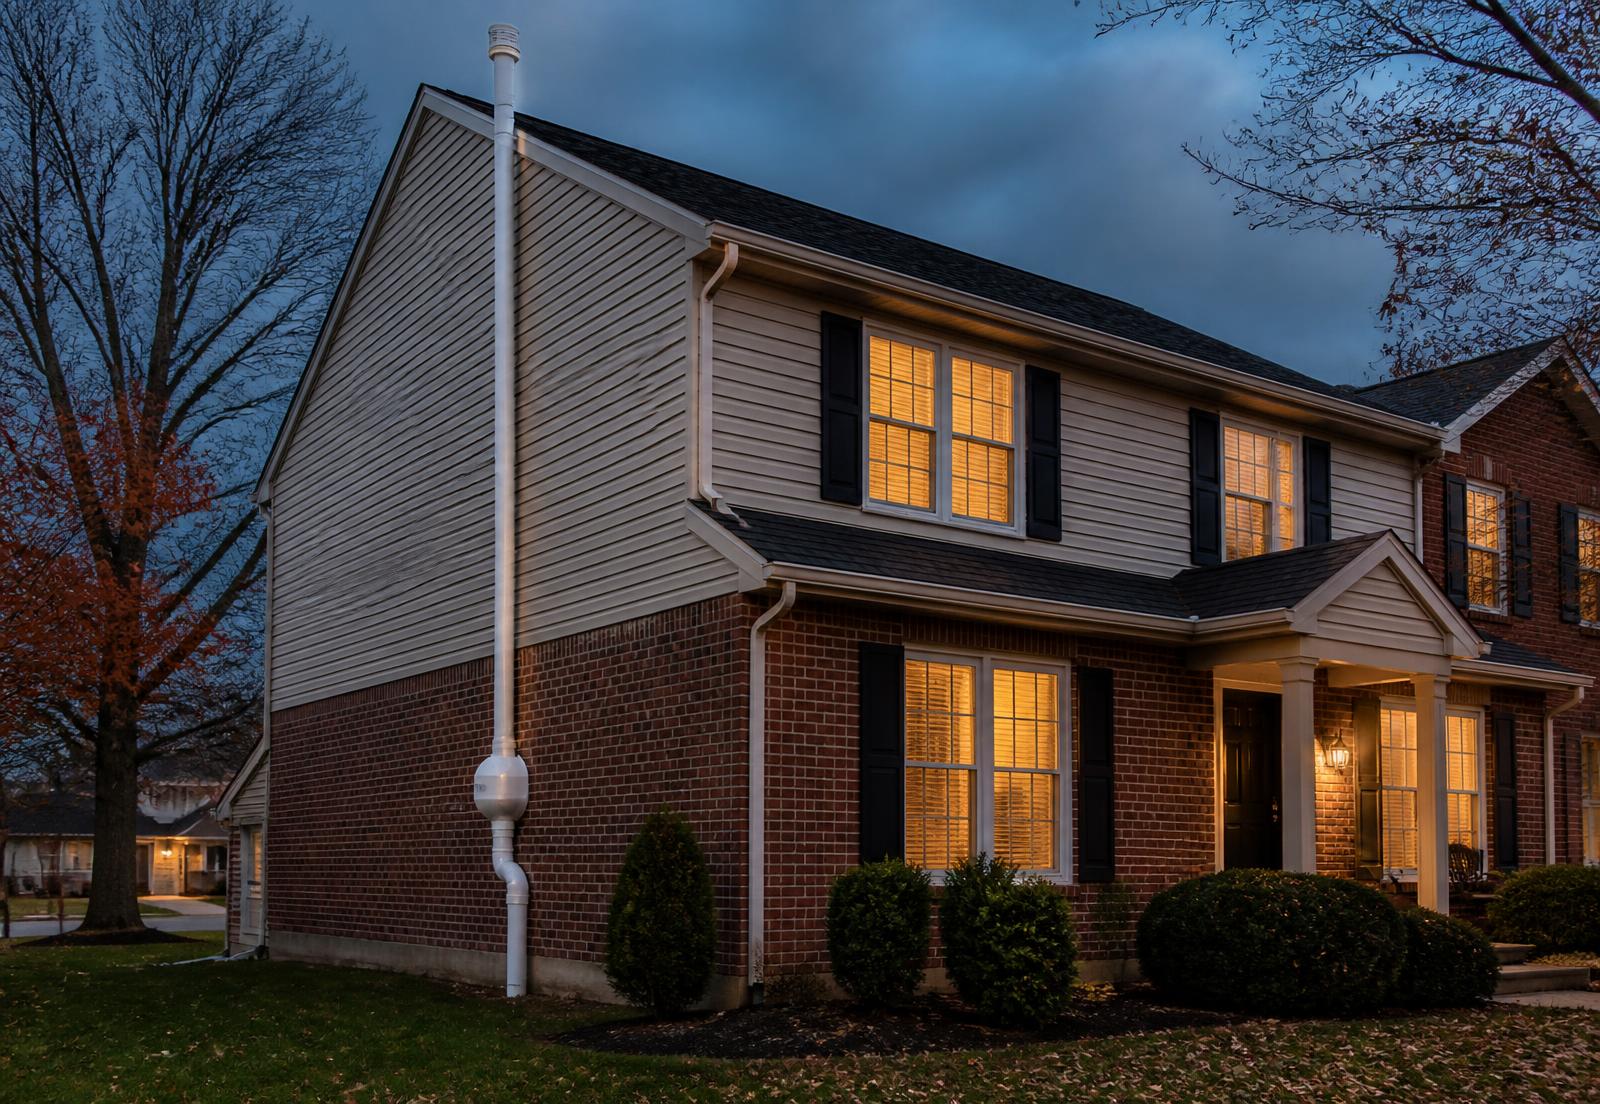
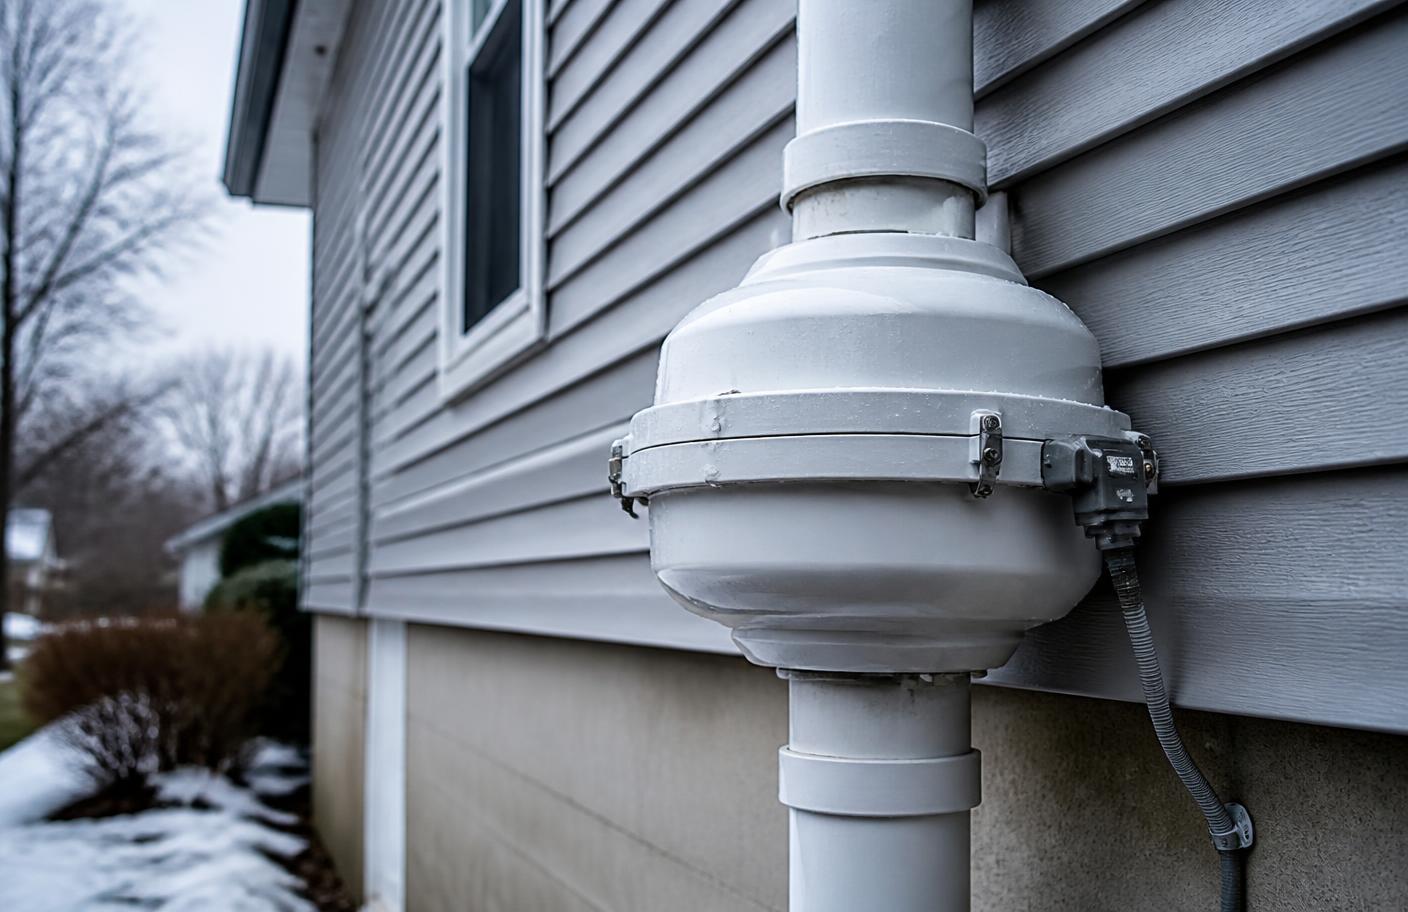
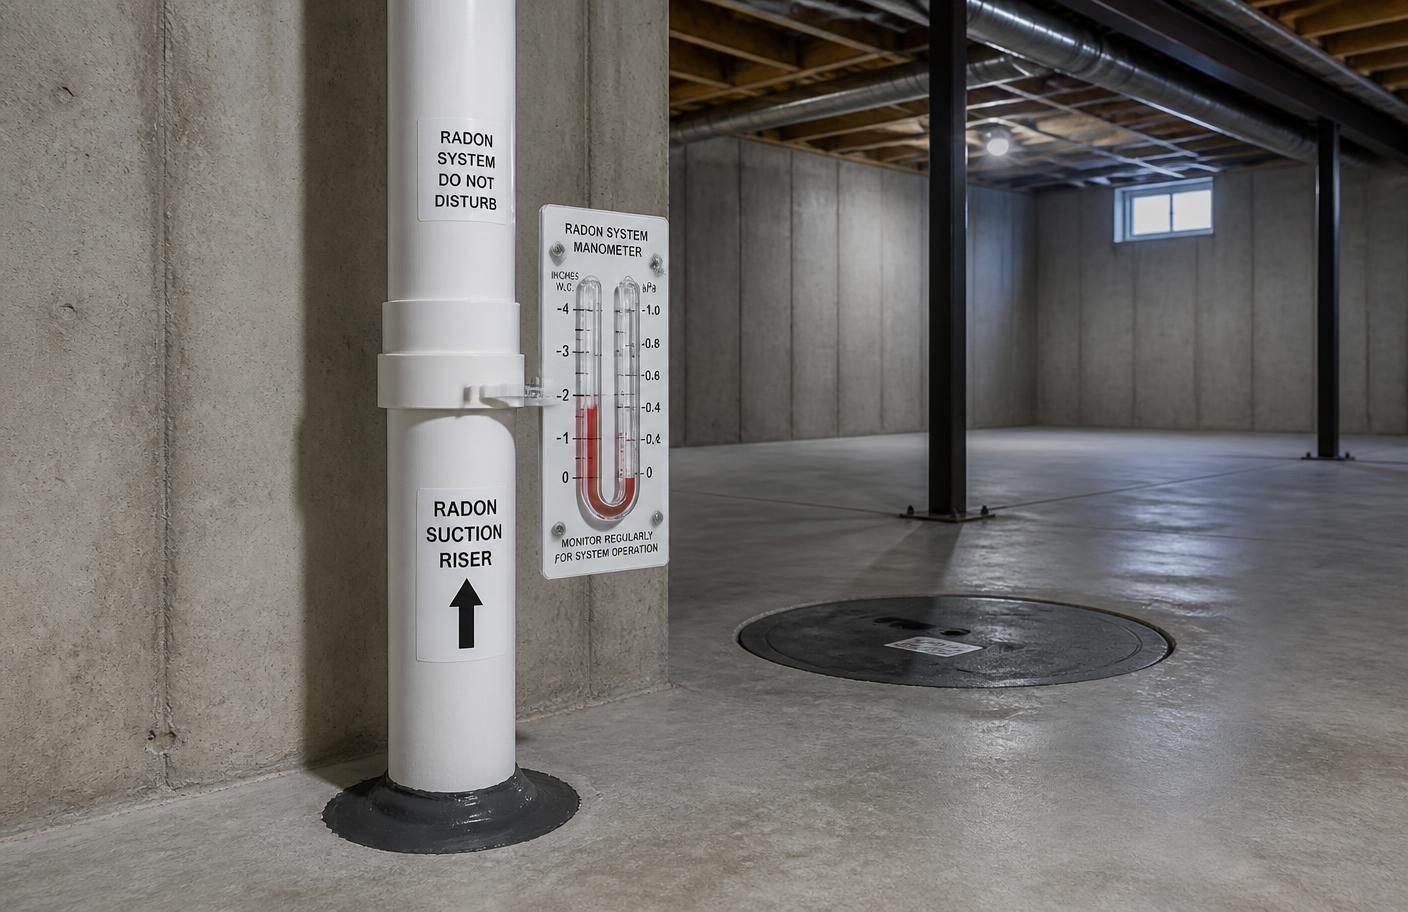
A confirmed result at or above 4.0 pCi/L generally warrants moving forward with mitigation. Results in the 2 to 4 pCi/L range are a judgment call that can reasonably factor in how long occupants spend in the home, whether young children or non-smokers live there, given radon's association with lung cancer risk as documented by EPA and CDC, and personal risk tolerance.
For guidance on the practical next steps after a high result, including choosing a system type and evaluating a mitigation proposal, see the What to Do If Radon Levels Are High guide and the Indiana Radon Mitigation Guide.
How This Differs From the Zone Map
It bears repeating because it's frequently confused: the EPA zone map that places Marion County and most of Central Indiana in Zone 1 is a planning tool based on predicted county averages, not a measurement of your home. This levels guide is about interpreting an actual test result from an actual house. The Indiana Radon Map Guide covers how to read the map itself and its explicit limitations as a decision-making tool.